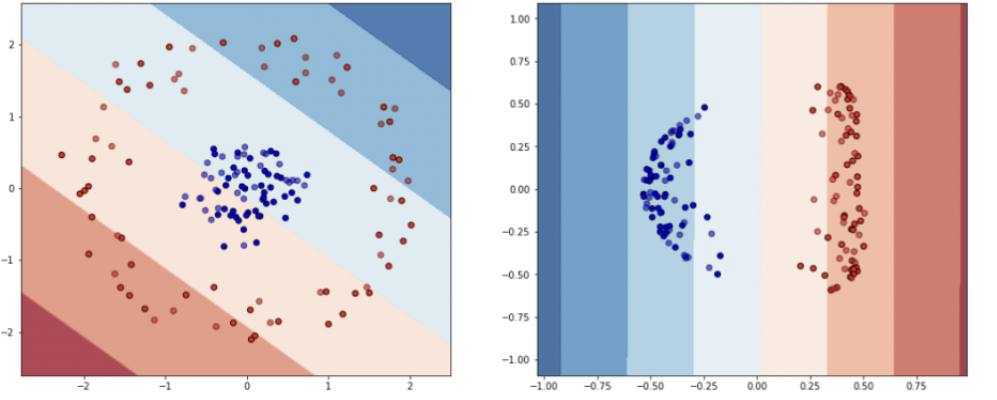
- not all machine learning algorithms rely on linear models and a clear parametric form
- does the green dot belong to the red or blue class?
- 1: train a logistic regression based in x and y-values
- 2: look for the
https://upload.wikimedia.org/wikipedia/commons/e/e7/KnnClassification.svg
- 1 How to calculate the distance?
- 2 what is a good number of
Euclidean distance
- most commonly used distance metric
- the length of a line segment between the two points
- calculated from the Cartesian coordinates of the points using the Pythagorean theorem
https://en.wikipedia.org/wiki/Euclidean_distance#/media/File:Euclidean_distance_2d.svg
One Dimension

Two Dimensions

https://en.wikipedia.org/wiki/Euclidean_distance#/media/File:Euclidean_distance_2d.svg
Example: Species Classification
- prediction of the species based on beak length and depth
| Observation | Species | Beak length in mm |
Beak depth in mm |
||
|---|---|---|---|---|---|
| 1 | 1 | Gentoo | 40 | 19 | ? |
| 2 | 1 | Gentoo | 39 | 21 | ? |
| 3 | 1 | Gentoo | 42 | 23 | ? |
| 4 | 0 | Adélie | 20 | 18 | ? |
| 5 | 0 | Adélie | 25 | 17 | ? |
| 6 | 26 | 19 | ? |

- Calculate the distance between observation 1 and 2:


- Calculate the distance between observation 1 and 2:
Distance Table for all Observations
- based on the beak length and depth
| 1 | 2 | 3 | 4 | 5 | 6 | |
|---|---|---|---|---|---|---|
| 1 | 0,00 | 2,24 | 4,47 | 20,02 | 15,13 | 14,00 |
| 2 | 2,24 | 0,00 | 3,61 | 19,24 | 14,56 | 13,15 |
| 3 | 4,47 | 3,61 | 0,00 | 22,56 | 18,03 | 16,49 |
| 4 | 20,02 | 19,24 | 22,56 | 0,00 | 5,10 | 6,08 |
| 5 | 15,13 | 14,56 | 18,03 | 5,10 | 0,00 | 2,24 |
| 6 | 14,00 | 13,15 | 16,49 | 6,08 | 2,24 | 0,00 |
- What species of penguin is observation 6 based on its three nearest neighbors?
- What species of penguin is observation 6 based on its three nearest neighbors?
- Number 5 (Adélie), 4 (Adélie) and 2 (Gentoo) are closest
- Number 6 is probably an Adélie
- We can use the majority vote to predict the species with a probability of 2/3
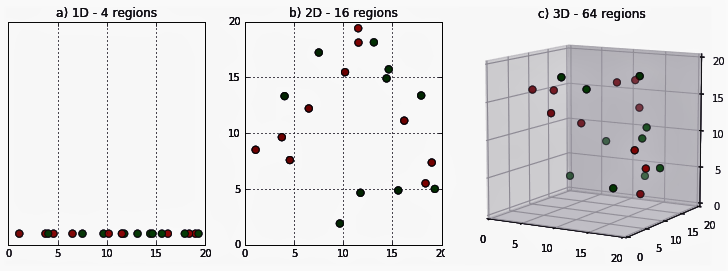
 Problem 1: Curse of dimensionality
- everything works fine, if we have a limited number of predictors (features)
- the volume of the space increases so fast that the available data become sparse

- if the number predictors becomes to large, we have have to reduce them
https://medium.com/analytics-vidhya/the-curse-of-dimensionality-and-its-cure-f9891ab72e5c
 Solutions
- features selection (we did this before)
- dimensionality reduction (we will cover this later)

https://neptune.ai/blog/dimensionality-reduction
 Problem 2: Differing Scales of Predictors
| Observation | Class | Beak length in mm |
Beak depth in mm g |
Weight in kg |
|
|---|---|---|---|---|---|
| 1 | 1 | Gentoo | 40 | 19 | 0.534 |
| 2 | 1 | Gentoo | 39 | 21 | 0.638 |
| 3 | 1 | Gentoo | 42 | 23 | 0.540 |
| 4 | 0 | Adélie | 20 | 18 | 0.453 |
| 5 | 0 | Adélie | 25 | 17 | 0.501 |
| 6 | 26 | 19 | 0.359 |
- If we just calculate the distance, the influence of weight is much lower!
 Solution: Scaling of Predictors
- We have no parameter in the model (compare
- In such cases we can prepare the data before training the model
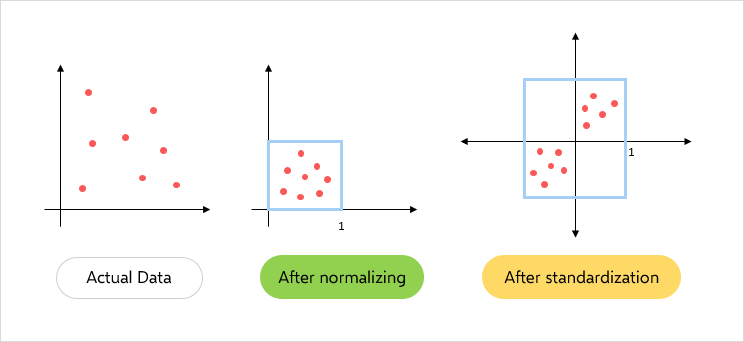
- Normalization of a Variable
- Standardization of a Variable
- Normalization of a Variable

- Normalization bounds the values between 0 and 1 based on the min and max values
- Standardization does not bound values to a specific range if we have outliers
https://becominghuman.ai/what-does-feature-scaling-mean-when-to-normalize-data-and-when-to-standardize-data-c3de654405ed
 Task
Task
- perform a normalization of the
Beak lengthand a standardization of theWeight.
| Observation | Class | Beak length in mm |
Beak depth in mm g |
Weight in kg |
|
|---|---|---|---|---|---|
| 1 | 1 | Gentoo | 40 | 19 | 0.534 |
| 2 | 1 | Gentoo | 39 | 21 | 0.638 |
| 3 | 1 | Gentoo | 42 | 23 | 0.540 |
| 4 | 0 | Adélie | 20 | 18 | 0.453 |
| 5 | 0 | Adélie | 25 | 17 | 0.501 |
| 6 | 26 | 19 | 0.359 |
 10 minutes, Solution
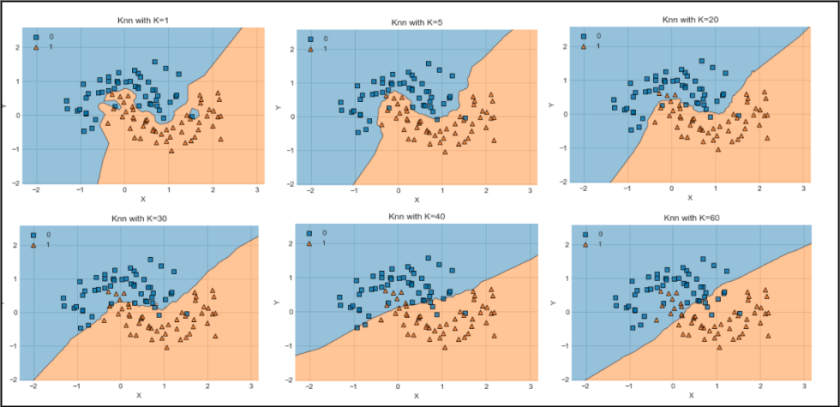
 Problem 3: How many neighbors to consider?

https://i0.wp.com/neptune.ai/wp-content/uploads/KNN-diagram.png?resize=840%2C407&ssl=1
- best choice of k depends upon the data
- larger values of
- smaller values of
- larger values of
- usually found by
- grid search: trying out different
- grid search: trying out different
2.8.2 
- In
- This value is the average of the values of
- instead of a class prediction
https://upload.wikimedia.org/wikipedia/commons/e/e7/KnnClassification.svg
What is a good estimate of the beak depth of number 6?
| Observation | Species | Beak length in mm |
Beak depth in mm g |
||
|---|---|---|---|---|---|
| 1 | 1 | Gentoo | 40 | 19 | ? |
| 2 | 1 | Gentoo | 39 | 21 | ? |
| 3 | 1 | Gentoo | 42 | 23 | ? |
| 4 | 0 | Adélie | 20 | 18 | ? |
| 5 | 0 | Adélie | 25 | 17 | ? |
| 6 | 0 | Adélie | 26 |  |
? |
- (2)-nearest neighbors based on a single feature
Class
 Case Study
- We will classify the penguin species and sex based on their characteristics using
https://www.scoopnest.com/user/AFP/1035147372572102656-do-you-know-your-gentoo-from-your-adelie-penguins-infographic-on-10-of-the-world39s-species-after
7 Classification and Advanced Supervised Learning
